Note
Click here to download the full example code
Node and Edge Artist Customisation
Node artists
The shape, size, and colour of node representations can be controlled via the following parameters:
node_shape: node shape; one of ‘so^>v<dph8’node_size: node radiusnode_edge_width: line width of node marker bordernode_color: node face colournode_edge_color: node edge colournode_alpha: node transparencynode_zorder: node z-order; artists with higher z-order occlude artists with lower z-order
Edge artists
The shape, size, and colour of edge representations can be controlled via the following parameters:
edge_width: edge widthedge_color: edge face colouredge_alpha: edge transparencyedge_zorder: node zorder; artists with higher z-order occlude artists with lower z-orderarrows: boolean flag that turn the drawing of arrow heads on or off
All node and edge artist properties can be specified in three ways:
Using a single scalar or string that will be applied to all artists.
import matplotlib.pyplot as plt
from netgraph import Graph

edges = [(0, 1), (1, 1)]
Graph(edges, node_color='red', node_size=4.)
plt.show()

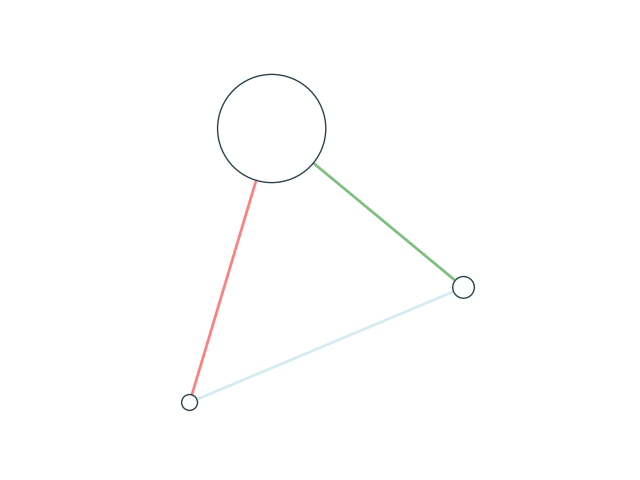
Using a dictionary mapping individual nodes or individual edges to a property:
import numpy as np
import matplotlib.pyplot as plt
from netgraph import Graph

Graph([(0, 1), (1, 2), (2, 0)],
      edge_color={(0, 1) : 'g', (1, 2) : 'lightblue', (2, 0) : np.array([1, 0, 0])},
      node_size={0 : 20, 1 : 4.2, 2 : np.pi},
)
plt.show()
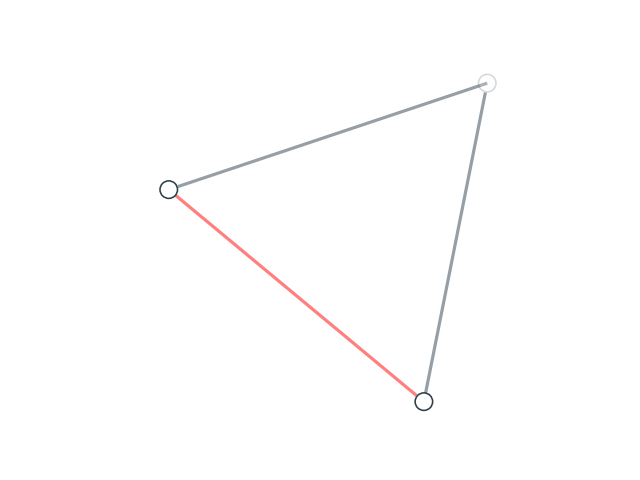
By directly manipulating the node and edge artists.
Node and edge artists are derived from the matplotlib.patches.PathPatch class,
such that any of its methods can be used to modify node and edge artists properties.
import matplotlib.pyplot as plt; plt.ion()
from netgraph import Graph

fig, ax = plt.subplots()
g = Graph([(0, 1), (1, 2), (2, 0)], ax=ax)
plt.show()

# make some changes
g.node_artists[0].set_alpha(0.2)
g.edge_artists[(1, 2)].set_facecolor('red')

# force redraw to display changes
fig.canvas.draw()
Total running time of the script: ( 0 minutes 0.272 seconds)